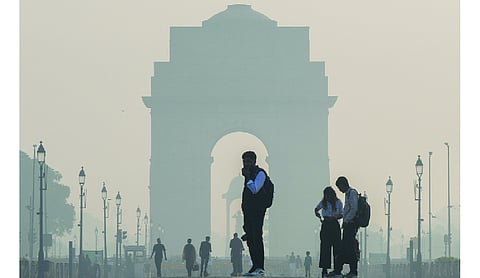

Delhi’s average PM2.5 concentration in the week preceding Diwali touched a three-year high of 236 micrograms per cubic metre, nearly double the level recorded last year. Vehicular emissions, pollution drifting from neighbouring NCR districts and persistent traffic congestion are emerging as major drivers of the capital’s worsening air quality, according to a new analysis by the Centre for Science and Environment (CSE) released on Wednesday.
The findings point to a deterioration in Delhi-NCR’s baseline air quality even before Diwali firecrackers and seasonal stubble burning added to the pollution burden. The analysis found that average PM2.5 levels during the pre-Diwali week were 97 per cent higher than the 120 micrograms per cubic metre recorded in 2025 and 32 per cent above the 179 micrograms per cubic metre registered in 2024.
The report also questioned the effectiveness of emergency traffic restrictions imposed under the Graded Response Action Plan (GRAP), stating that the curbs failed to improve weekday congestion significantly. It found that evening traffic continued to expose residents to elevated levels of nitrogen dioxide (NO2), a pollutant largely associated with vehicular emissions, with concentrations remaining high until midnight.
Drawing on air quality data from the Central Pollution Control Board (CPCB), pollution-source estimates from the Indian Institute of Tropical Meteorology (IITM), crop-fire data from the Indian Agricultural Research Institute and traffic analytics from TomTom, the analysis attributed the deterioration to inadequate year-round emission control.
“Baseline pollution is higher than in previous years,” said Anumita Roychowdhury, executive director of research and advocacy at CSE, arguing that firecrackers and farm fires had aggravated an already polluted atmosphere rather than being the sole cause of the crisis. An analysis of IITM’s Decision Support System data for November 1-8 found that pollution transported from neighbouring NCR districts accounted for 54.43 per cent of Delhi’s PM2.5 burden, while local sources contributed 33.06 per cent and stubble burning accounted for 14.29 per cent.
Among Delhi’s local emission sources, vehicular transport was the largest contributor at 52 per cent, followed by residential activities at 13 per cent and peripheral industries at 11 per cent. Construction contributed seven per cent, while energy use and waste burning accounted for five per cent each. Road dust and other sources contributed four per cent each.
The analysis also found that severe pollution episodes continued even as farm fires’ contribution declined. Stubble burning’s share of Delhi’s PM2.5 pollution stood at 3.9 per cent during the initial GRAP Stage I restrictions, rose to 11.5 per cent on November 1, and subsequently declined to 8.6 per cent on November 2. It peaked at 16.2 per cent on November 4 before falling to around eight per cent on November 6, when Delhi’s AQI reached 382, and GRAP Stage III restrictions were invoked.
The study also flagged a shift in Delhi’s pollution hotspots. While 11 of the city’s 13 officially designated hotspots recorded lower PM2.5 concentrations between October 1 and November 8 than in the same period last year, several other locations emerged as areas of concern.
Anand Vihar recorded a 49 per cent decline, followed by Wazirpur at 41 per cent, Ashok Vihar at 40 per cent and Bawana at 22 per cent. However, Jahangirpuri remained the most polluted designated hotspot, with an average PM2.5 concentration of 163 micrograms per cubic metre.
Among emerging hotspots, Vivek Vihar recorded 144 micrograms per cubic metre, followed by Sonia Vihar at 139, ITO at 137 and Delhi Technological University at 135. On the effectiveness of traffic restrictions, CSE’s analysis found that Delhi recorded an average daily Travel Time Index (TTI) of 2.40 during November 2-6, against 2.38 on October 30, immediately before the restrictions. The evening peak index also remained virtually unchanged at 3.49 against 3.48.
Between January and April, commuters took 13 per cent longer to complete journeys than under normal weekday conditions. Evening journeys took 13 to 31 per cent longer. Nitrogen dioxide concentrations also rose by nearly one-third from November 2, even as congestion levels remained largely unchanged.